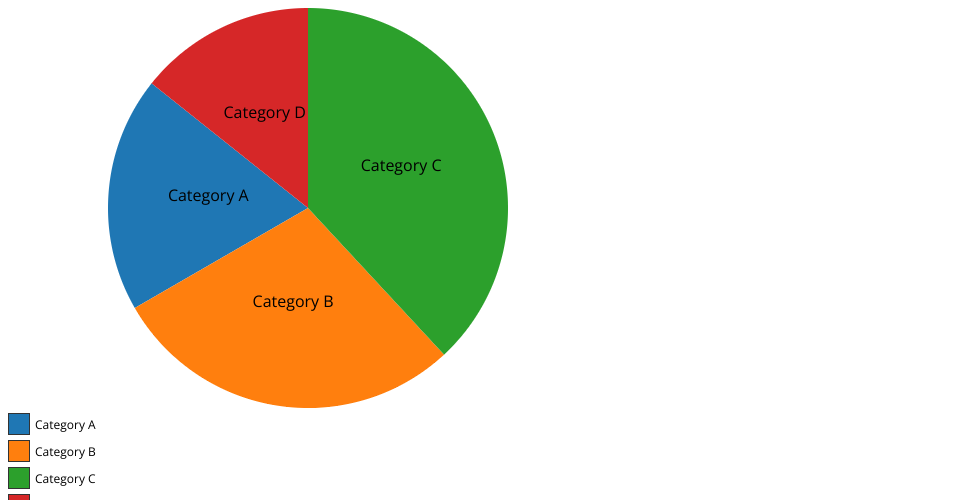
Enhanced Pie Chart
This HTML file generates an interactive pie chart using D3.js library to visualize sales data for product categories. Each category is represented by a slice, with colors indicating different categories. Hovering over a slice displays the category name and corresponding sales value in a tooltip. Additionally, a legend is provided to identify each category's color.
MIT Licensed