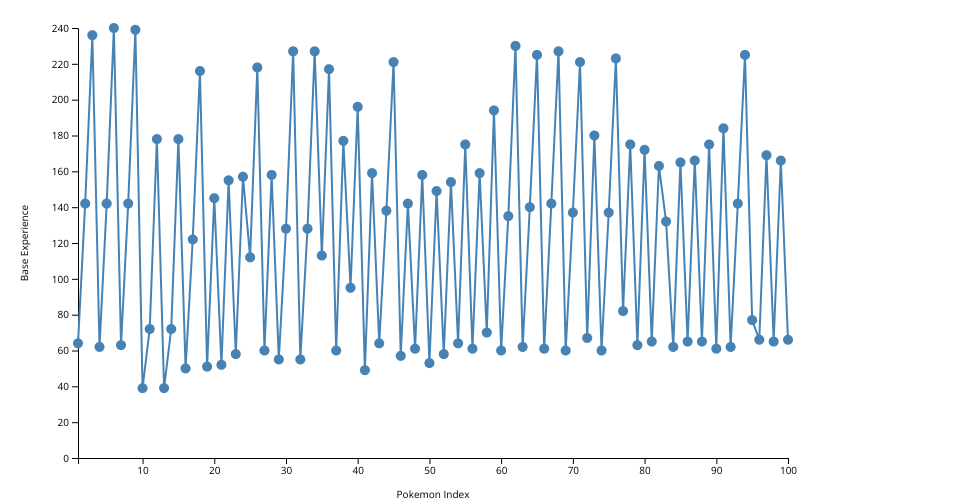
Line Chart with Axes Labels
- Fetches Pokémon data from the PokeAPI
- Renders a line chart displaying base experience values for each Pokémon
- X-axis represents the Pokémon index, and Y-axis shows the base experience
- Interactive tooltip reveals Pokémon name and base experience on mouseover
- Utilizes D3.js for data visualization and charting
MIT Licensed