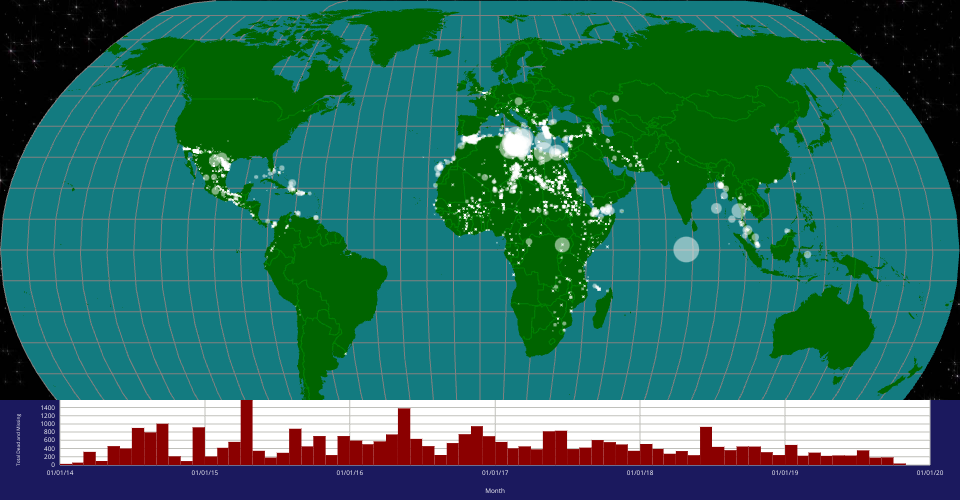
Using D3 and React to display missing and dead migrants over time on a globe, and using an aggregated bar chart.
Hovering over a white circle will give more information about the report.
The histogram displayed at the bottom can be brushed over to display specific time spans.
MIT Licensed