Final Project
Dataset
The dataset can be found here
Project README
The readme chronicling work completed can be found here
What This Shows
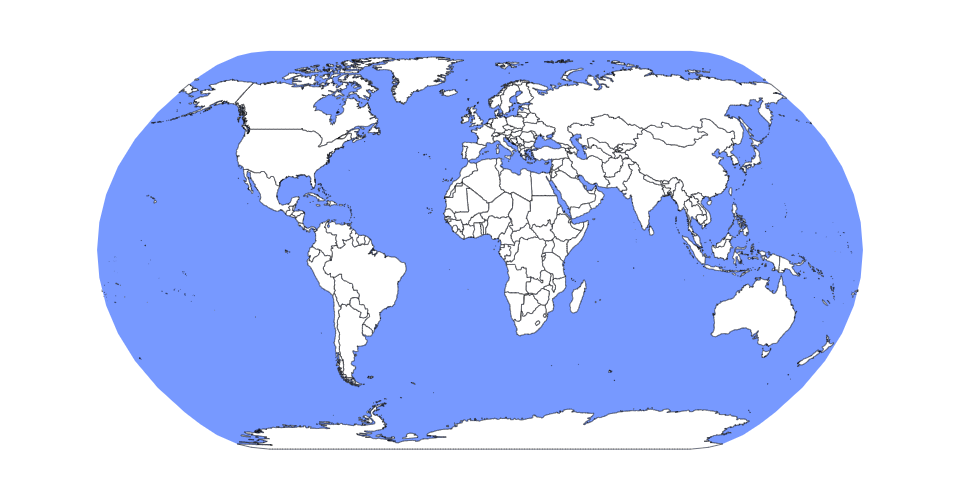
This viz has a view of the world stacked on top of a scatterplot below showing the standard elo of a player relative to their standard elo, so it begins as a line of dots.
Features
Menus
When changing to another value using the menu selector, the columns of interest in the data change and the scatterplot reflects the new columns. This can be used to augment the scatterplot to see different relations between ratings and rankings by region. These chosen columns will be reflected as more filtering of data occurs through the country selector and brushing. The title of the scatterplot will update as the columns change.
Country Selector
Countries can be selected for data filtering by selecting the map above. By selecting up to 20 countries, each will be assigned a color that will be reflected below in the scatterplot points. These points are filtered by treating the selected country as the destination. By selecting Russia, the points shown in the graph will be those that have Russia as a destination.
Brushing
By selecting a region of points in the scatterplot below, the countries selected can be highlighted. These highlighted countries are only the countries that appear as destinations in the subset highlighted by brushing. This can be used to see a subset of points based on rating score, to see where strong players are going.