Car Attributes by Make Visualization
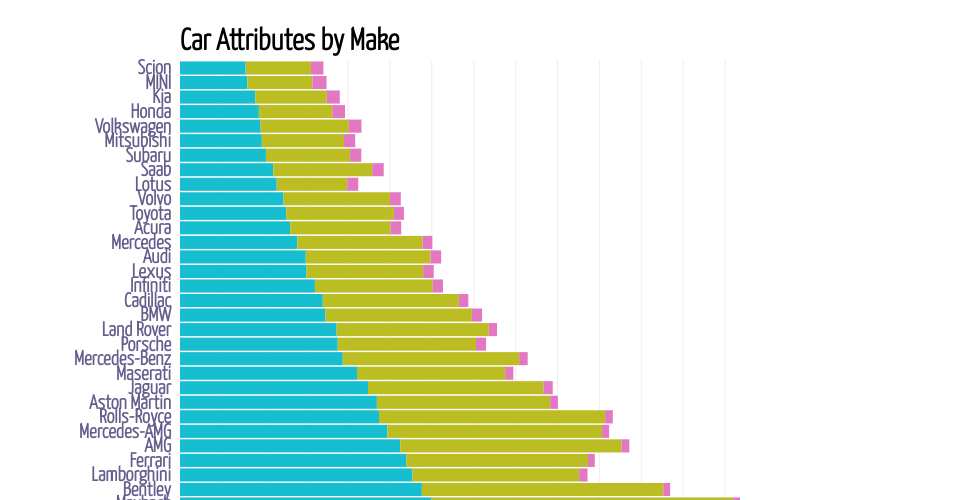
This stacked bar chart gives the value of each attribute within different cars makes. The purpose is to highlight the distribution of these key attributes across various car manufacturers, giving insights into their performance characteristics. When the mouse hovers over each bar, you can see pop-ups of accurate value of each attribute within each car makes.
MIT Licensed