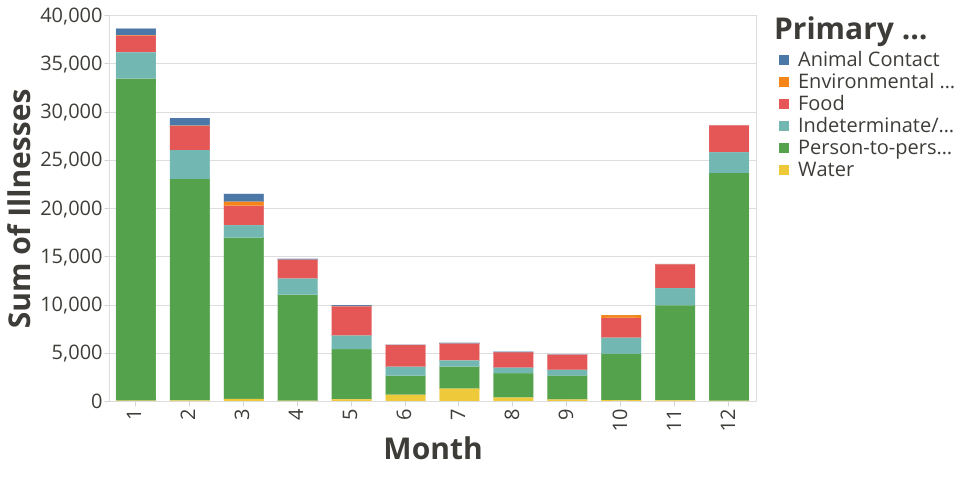
This bar plot shows the number of outbreaks in different months as well as the distribution of differet types of disease in each month.
We can see from the plot that person-to-person takes up most in outbreaks during the year especially in winter. In summer, food almost takes the lead on proportion. We may conclude that person-to-person is the most common infection way.
The dataset comes from Gist
MIT Licensed