Monthly Data Visualization Bar Chart
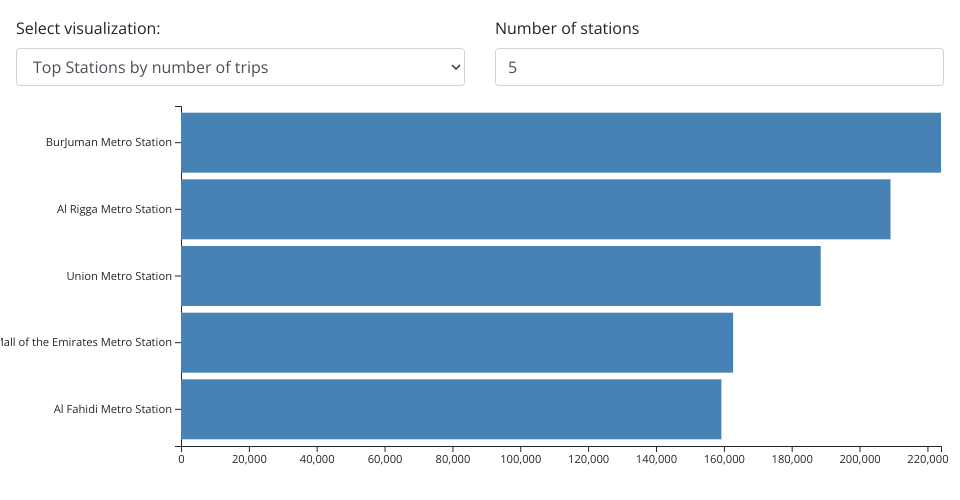
Bar chart visualization for Dubai Metro for monthly data.
Folder Structure:
index.html- main html view fileindex.js- main js file or entrypointstyles.css- css file for stylingconfig.js- js module for storing configurations for example bar chart configs and validation level params(single source of truth for all app level configs).helper.js- helper function module.validation.js- validation logics can be added here.bar.js- logics for bar graphdata.csv- file for storing csv data obtained from dubaipulse website.
How it works:
From the dropdown, select type of grouping needed to be visualized, for example top 10 stations will require you to select
top stationsoptions and entering a value of 10 in input box.As you press up or down key in input box, the visualization will update.
Updating a value in input box and on blur the chart will update.
Limitations:
- The number of stations must be greater than 0 and less than 20.
- Entering value greater than 20 or less than 0 will result in error alert.
MIT Licensed