Stacked Bar Chart with D3.js
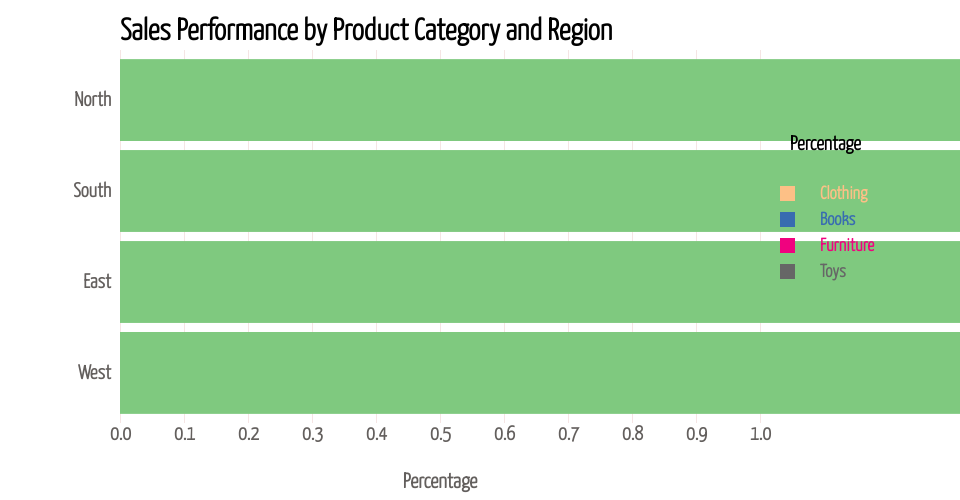
This project demonstrates how to create a stacked bar chart
using D3.js. The dataset used is provided in data.csv. The
visualization is implemented in index.html using D3.js.
Styling for the visualization is done in styles.css.
Usage
- Clone or download the repository.
- Open
index.htmlin a web browser.
Dataset
The dataset (data.csv) contains sales performance data of
different product categories across various regions.
Libraries Used
- D3.js (Data-Driven Documents)
MIT Licensed