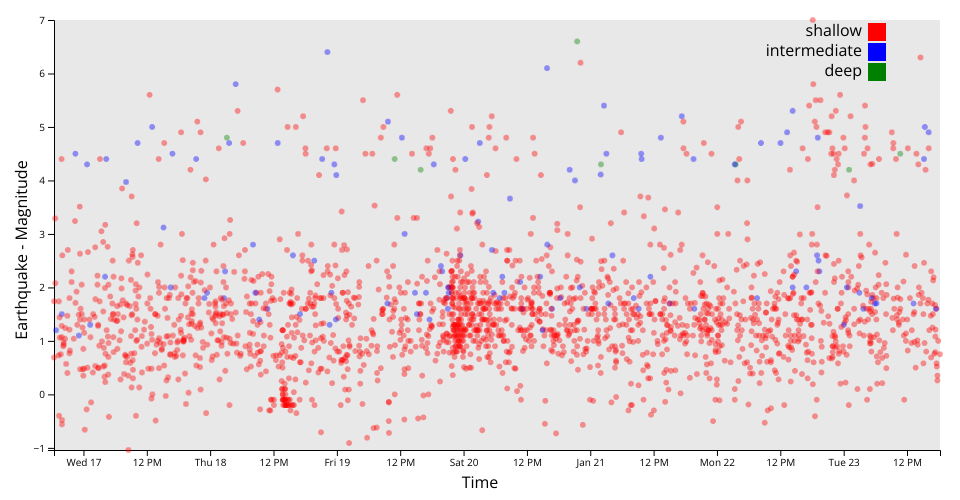
A scatter plot shows both magnitude and depth of the earthquakes happened in the past 7 days.
This plot was integrated with responsive viz container and responsive axes.
Data can be found here: Earthquake Dataset.
The depth of the earthquake is categorized into 3 levels:
- RED: Shallow: depth < 70km
- BLUE: Intermediate: 70km <= depth < 300km
- GREEN: Deep: depth >= 300km
MIT Licensed