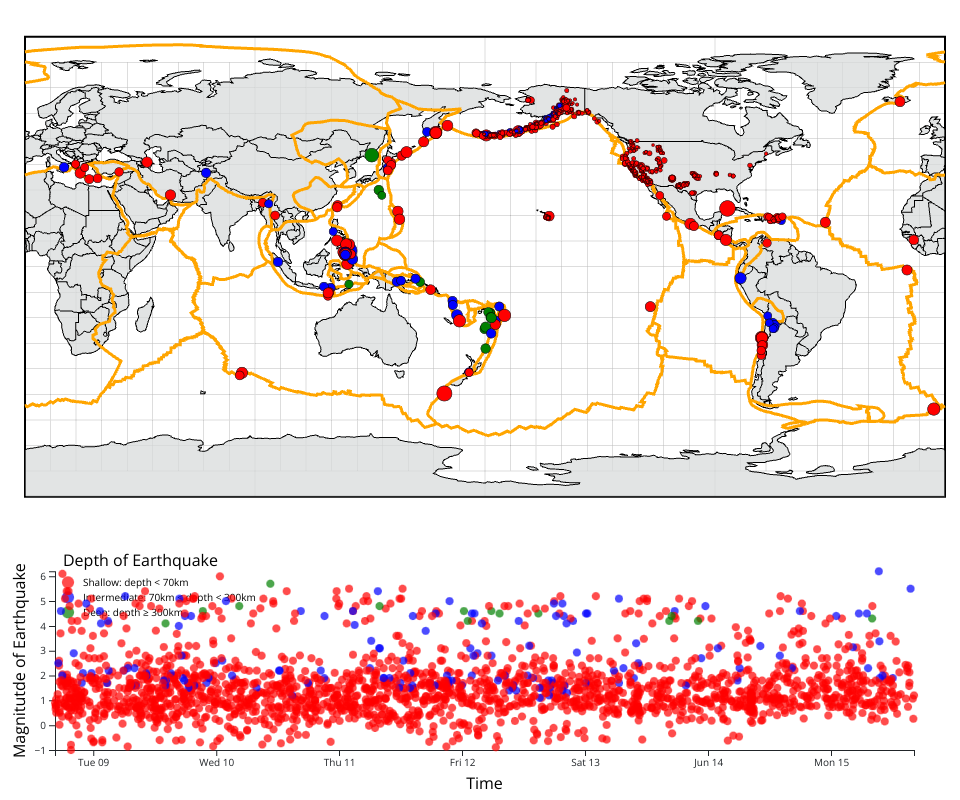
In the map
- data from an USGS API
- circle size related to magnitude value
- interaction: click circle and direct to a url
- added color to the circles, according to depth (shallow, intermediate, deep)
- added tooltip
In the scatter plot
- added brush
Interaction:
Use a brush tool on the scatter plot to select the earthquakes that you want to display on the map.
MIT Licensed