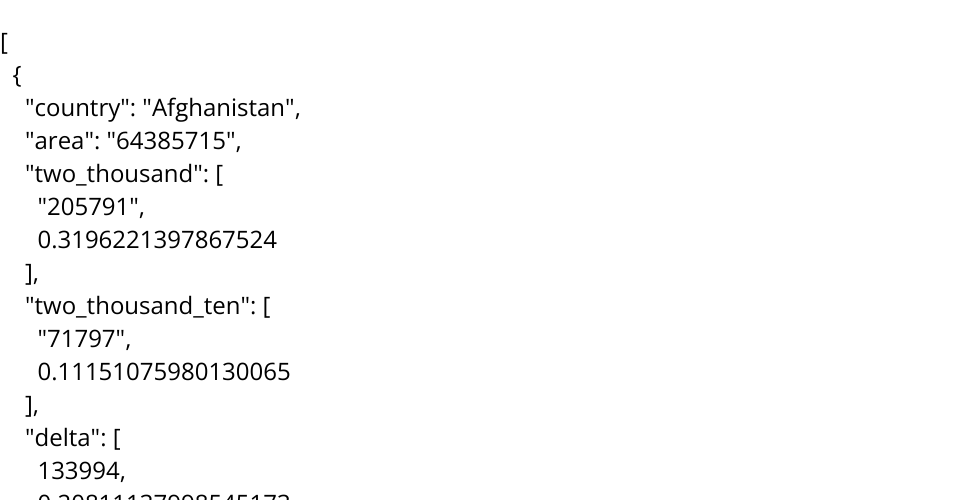
This data transformation singles out all of the data with a tree coverage threshold of 30%, which is the default for most analysis. It then compares the tree coverage in 2000 and 2010 in area, given in hectares, and then as a percentage of the total country area. Lastly, the difference in both area and percentage between 2010 and 2000 is calculated.
This dataset details the change in tree cover across the globe between 2000 and 2021 for different countries. It was taken from satellite data by Hansen et. al (2013) with changing data collection methodology after this year. For this dataset, questions I would be interested in investigating include: are there differences in deforestation in different areas of the globe? Can these differences be related to economic status? Can they be related to starting forest density? What areas show reforestation?
Sources: https://www.globalforestwatch.org/dashboards/global/?category=forest-change
https://www.science.org/doi/10.1126/science.1244693
From the data coversheet: "This data set includes tree cover extent, aboveground live woody biomass (AGB) stocks and densities, annual tree cover loss, annual forest greenhouse gas (GHG) emissions, average annual forest CO2 removals (sequestration), and average annual net GHG flux at the country and first (state, province) sub-national levels.
- Tree cover loss and emissions are available as annual data for 2001-2021.
- Emissions, removals and net flux are available as annual averages for 2001-2021.
- Tree cover is available for 2000 and 2010.
- Aboveground biomass stocks and densities are available for 2000. The tree cover data was produced by the University of Maryland's GLAD laboratory in partnership with Google (Hansen et al. 2013). Carbon densities, emissions, removals, and net flux (megagrams CO2e/yr) are from Harris et al. 2021. The emissions data quantifies the amount of carbon dioxide emissions to the atmosphere where forest disturbances have occurred, and includes CO2, CH4, and N2O and multiple carbon pools. Removals includes the average annual carbon captured by aboveground and belowground woody biomass in forests. Net flux is the difference between average annual emissions and average annual removals; negative values are net sinks and positive values are net sources. Tree cover loss, tree cover extent, and AGB stock and density are presented for percent canopy cover levels >10%, 15%, 20%, 25%, 30%, 50% and 75% in 2000. Emissions, removals, and net flux are presented only for percent canopy cover levels >30%, 50%, and 75% in 2000, plus areas with tree cover gain regardless of percent canopy cover. We recommend that you select your desired percent canopy cover level before your analysis and use it consistently throughout analyses. The Global Forest Watch website uses a >30% canopy cover threshold as a default for all statistics."
The attributes of the dataset are:
| Column No. | Attribute Name | Data Type | Description |
|---|---|---|---|
| 1 | country | Categorical | Country |
| 2 | threshold | Ordinal | Percent canopy cover level in 2000 |
| 3 | area_ha | Quantitative | Country Area |
| 4 | extent_2000_ha | Quantitative | Forest extent in 2000 |
| 5 | extent_2010_ha | Quantitative | Forest extent in 2010 |
| 6 | gain_2000-2012_ha | Quantitative | Forest gain between 2000 and 2012 |
| 7-27 | tc_loss_ha_year | Quantitative | Tree cover loss per in specified year |
All data given in hectares.