The New York City Air Quality Data.
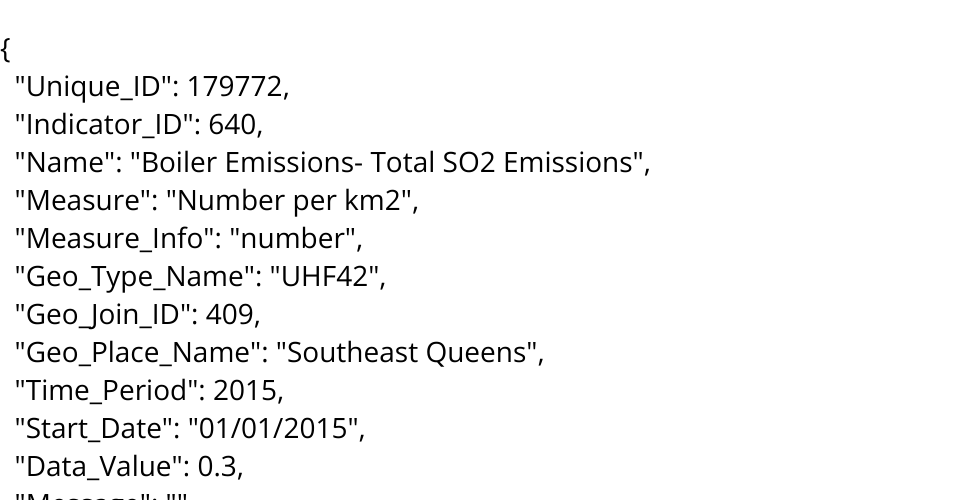
This data contains air quality measured at various locations over the last decade in NYC. It also breaks down the air quality by emission source and emission type.
Note: The CSV data was slightly modified (adding "_"s to field names instead of spaces) to make parsing easier.
Tasks:
- I want to visualize the total size of emissions by source throughout the city using a bubble chart
- I want to see how total emissions have changed over time
- I want to understand how total emissions across all sources changes geographically
- I want to visualize emissions by type geographically, using a different color for each emission type on a map
- I want to understand the correlation between emission source (e.g., boiler) and emission (SO2) for different emissions. This could be represented using a pie chart
MIT Licensed