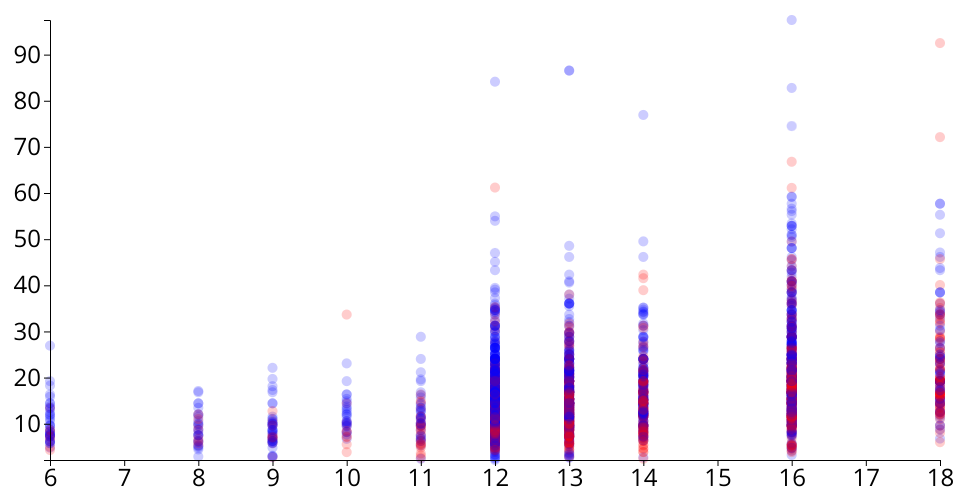
A D3 scatter plot shows the relationship of years of education and earning for males and females.
Data: Earnings and Education Dataset.
y-axis:
Earnings (dollars per hour)
x-axis:
Years of education
Color:
Blue points: male
Red points: female
MIT Licensed