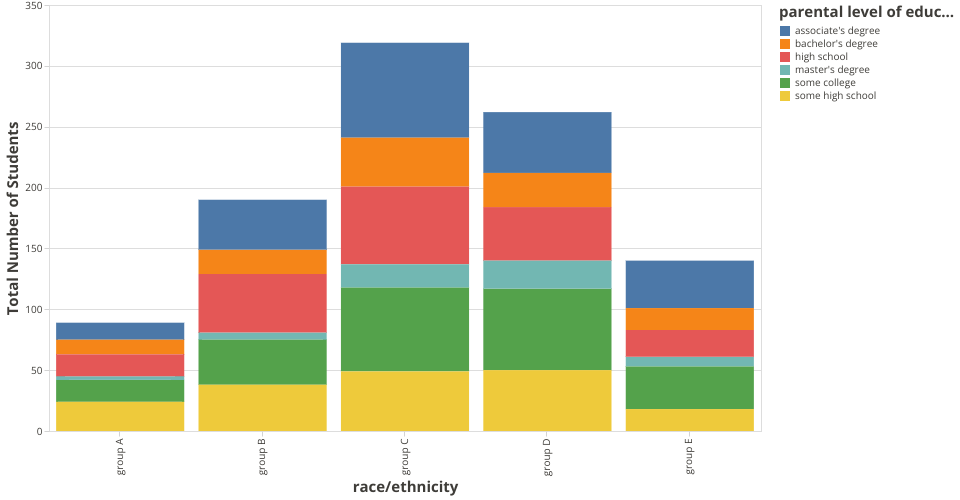
This bar chart visualization shows the parental level of education distribution along with different race/ethnicity.
A visualization constructed using the vega-lite-api.
See Data on Gist: Student Performance Data
MIT Licensed
This bar chart visualization shows the parental level of education distribution along with different race/ethnicity.
A visualization constructed using the vega-lite-api.
See Data on Gist: Student Performance Data