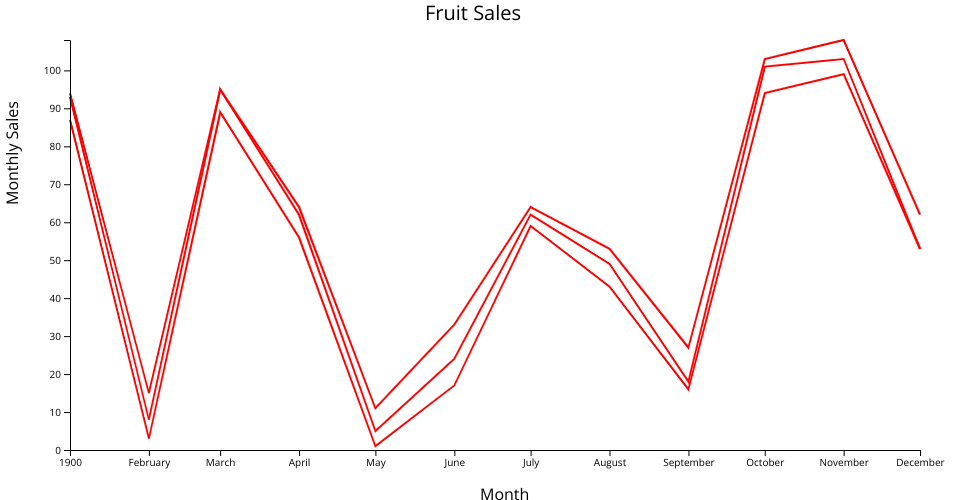
An exploration of nesting data. Example 2.1 line chart with data nested.
Using the tutorial and series of charts described here:
https://amber.rbind.io/2017/05/02/nesting/
NOTES: tricky elements here are:
- setting up the data binding so that it selects the nested data for the line correctly
- setting up the scales so that they get the max and min values from the nested data correctly*
*Accessing the values is described here: https://stackoverflow.com/questions/37688982/nesting-d3-max-with-array-of-arrays
max_value = d3.max(data, function(topLevel) { return d3.max(topLevel.values, function(bottomLevel) { return bottomLevel.valuesNeededName; }); });
*Creating and accessor function that enables the values to be selected at the bottom level - allowing refactoring and reduction in code volume.
https://stackoverflow.com/questions/17156800/nested-arrays-in-d3-js
function getValue(aValue){ return aValue.valuesNeededName }; const maxValue = d3.max(data.values, getValue);
D3.js version: v5.
D3 pattern used:
A vanilla HTML implementation.
Reusable structure:
- derived from Mike Bostock's Towards Reusable Charts (https://bost.ocks.org/mike/chart/) as the source of the foundational principles.
- But uses the ProD3 pattern (Pro D3.js Use D3.js to Create Maintainable, Modular, and Testable Charts by Marcos Iglesias https://www.apress.com/gp/book/9781484252024) as the basis for the charts.
Addtional help from and aknowledgement to:
Mastering D3.js by Castillo Pablo Navarro. https://www.packtpub.com/web-development/mastering-d3js
Data Visualization with D3.js Cookbook by Nick Qi Zhu https://www.packtpub.com/product/data-visualization-with-d3-js-cookbook/9781782162162