Uses Observable Plot with vanilla HTML.
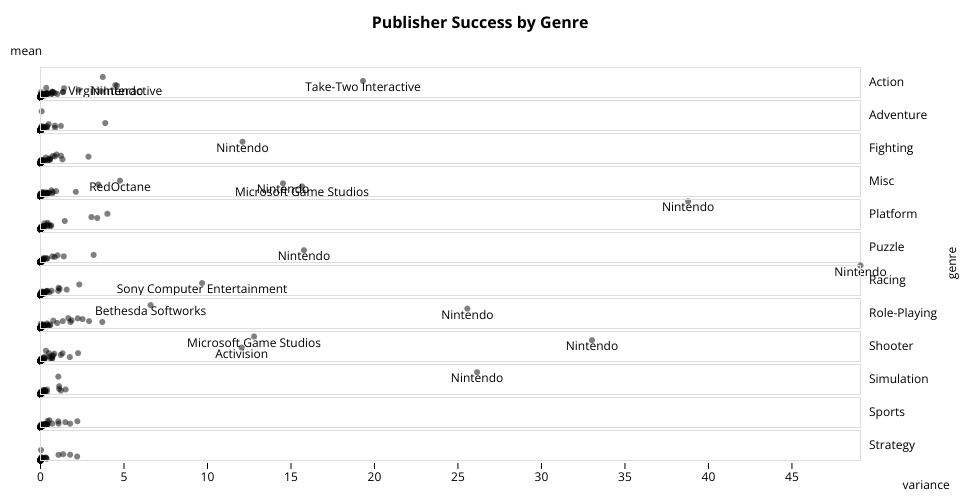
This plot graphs mean vs variance in a set of small multiple scatter plots. I was considering doing a SPLOM, but wasn't sure how the trending would look at this time. Instead, I refactored this set of scater plots to contain labels on outlier data points.
To do this, I again used a z-score threshold to filter the variance of points, but this time, to include text marks on the observable plot.
As expected, many well-known game studios are listed in the outliers (such as Nintendo).
MIT Licensed