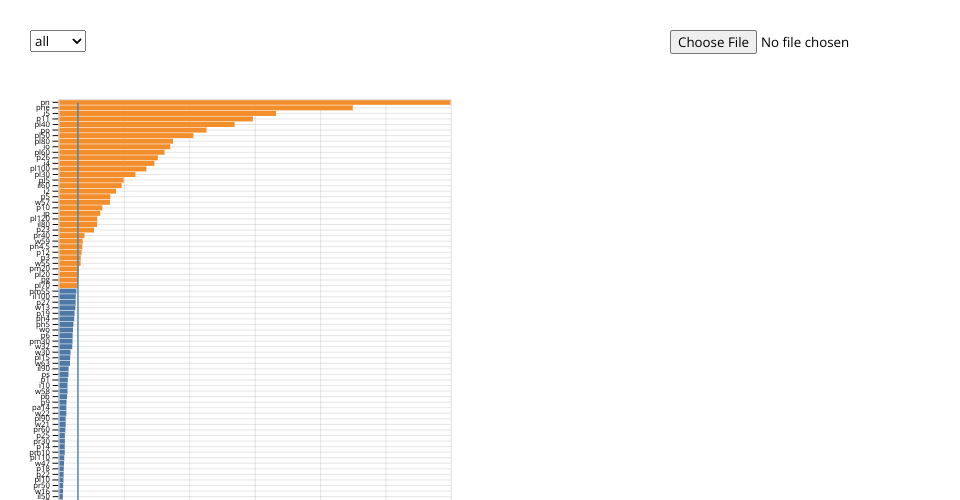
This is a bar chart of the various categories in the Tsinghua-Tencent 100K dataset.
New functionality:
The data is broken into each one of its folders, plus an additional category containing all of the data (all). The different folders can be viewed via a select menu in the top left of the UI.
The user has the ability to upload a json file for comparison to the original annotations.json. This file can be uploaded via a button in the top right of the UI.
MIT Licensed