Forked and authored by Daniel Ribaudo.
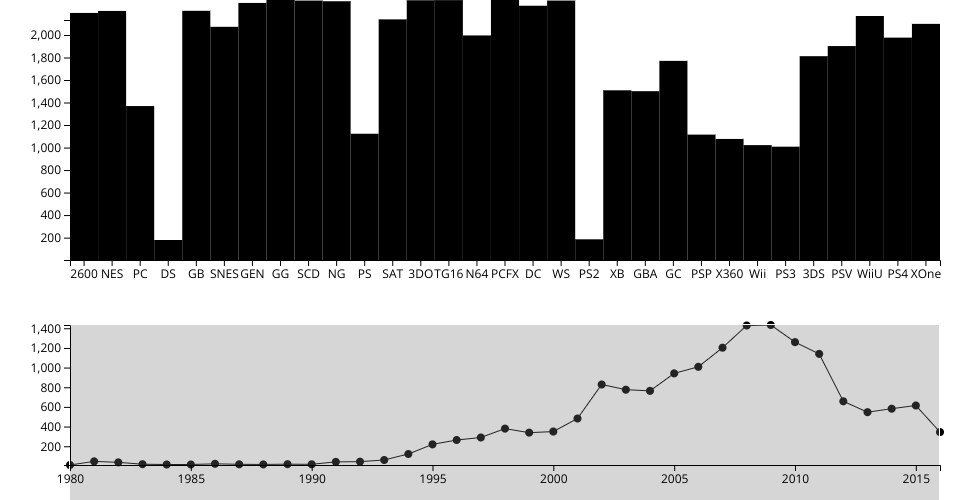
The data visualized comes from this gist: Video Game Sales
The bottom line graph shows the total number of video games released throughout each year. Brushing a year range within this line graph makes a second graph above it. This second graph is a bar chart which records the distribution of which platforms recieved releases in the selected years.
To improve this graph, labels and titles would need to be added to give a user a sense of what the graphs represent without needing to consult this README.
MIT Licensed