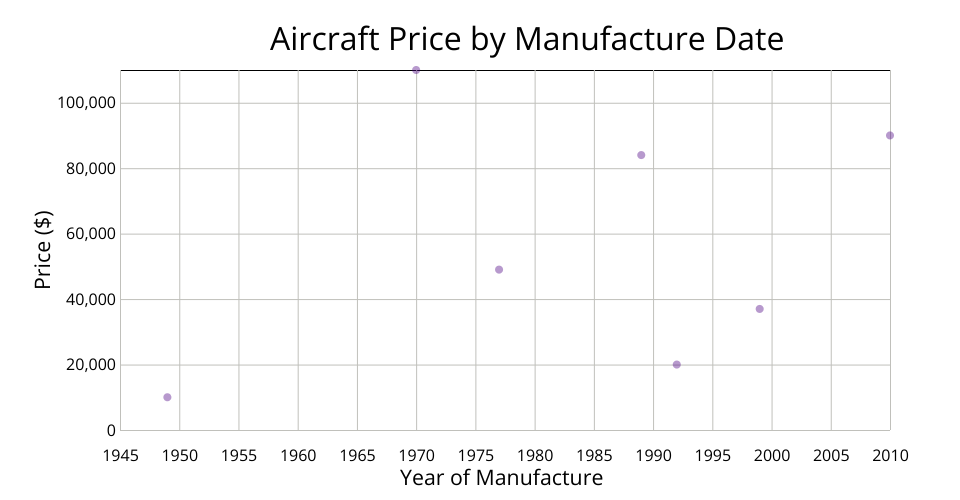
This is a practice bar chart using data from different aircraft types and their powerplant configuration.
In data.csv line 1: change the names "item" and "quantity" to your new parameters. In index.js rename "item" and "qauntity" to your new names as above (see lines 19,20 and 79). In index.js file rename the chart title, x axis label, margins, ticker intervals as desired.
MIT Licensed