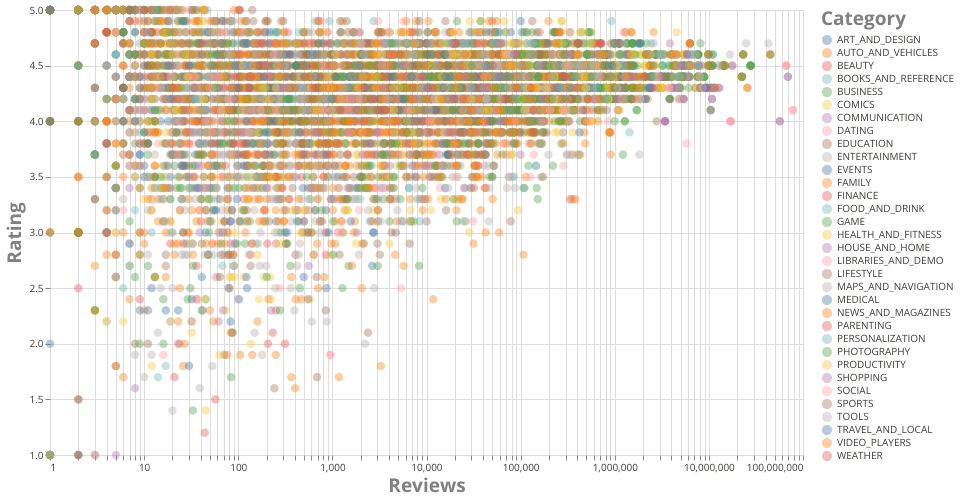
A Scatter plot for Google Play Store Apps dataset using the vega-lite-api.
It's designed to show the relationship between Rating and Number of Reviews.
Each circle represents an app. Different colors represent different app category.
MIT Licensed
A Scatter plot for Google Play Store Apps dataset using the vega-lite-api.
It's designed to show the relationship between Rating and Number of Reviews.
Each circle represents an app. Different colors represent different app category.