Histogram
Definition
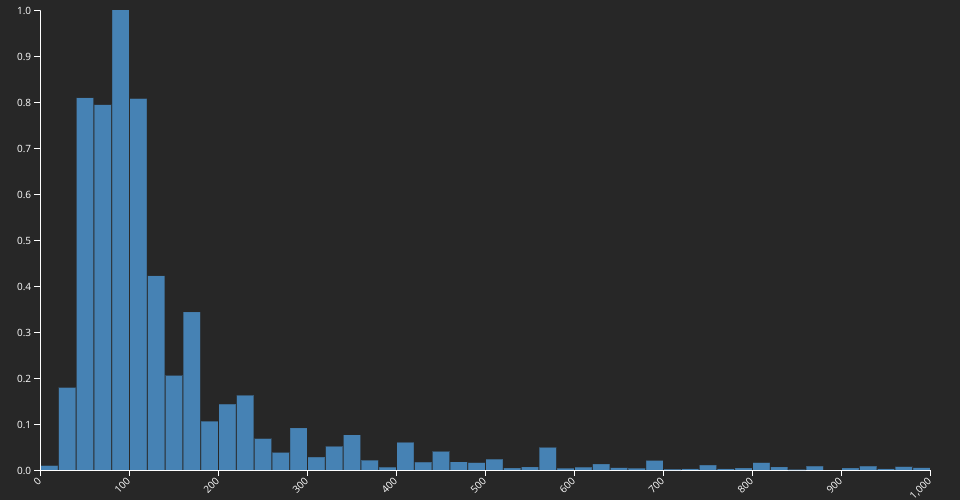
A histogram is an accurate graphical representation of the distribution of a numeric variable. It takes as input numeric variables only. The variable is cut into several bins, and the number of observation per bin is represented by the height of the bar.
What For
Histogram are used to study the distribution of one or a few variables. Checking the distribution of your variables one by one is probably the first task you should do when you get a new dataset. It delivers a good quantity of information.
Steps:
- A histogram displays the distribution of a numeric variable. So you basically need only one column in your input file.
- This numeric variable is provided to the d3.histogram() function that will compute the binning and returns the coordinates of each bar.
- These bars can thus be drawn using a classic .append("rect") approach.
MIT Licensed