What regions have the highest densities of extinct/endangered languages?
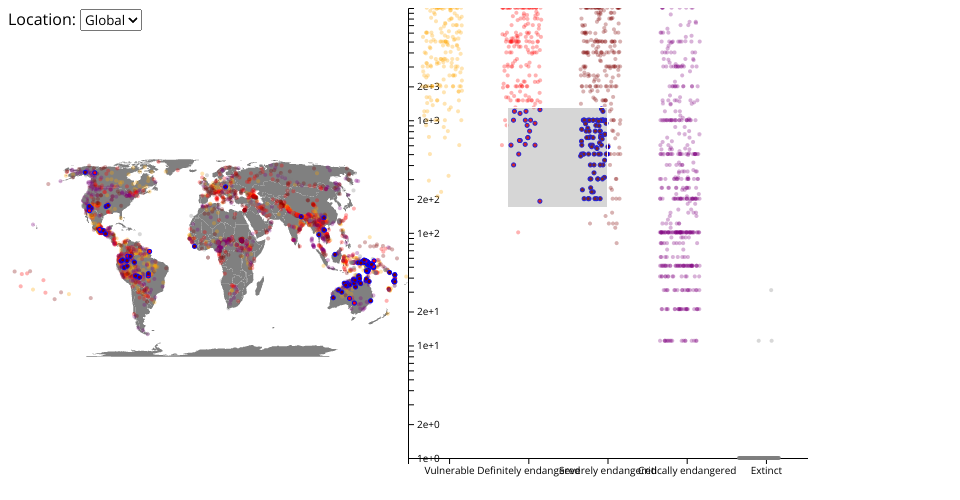
How is the number of speakers of a language related to its level of endangerment?
This is a connected map/scatterplot encoding. The colors represent the level of endangerment of a given language and are consistent across the two charts. There is a brush function that allows you to isolate a given section of the scatterplot. The Y-Axis of the scatterplot is the Number of Speakers of a given language. The dropdown menu is not functional yet
TBD Drop down on chart actually functions lol Cleaning up of Axes/Labels
Basic bar chart of total amount of Languages of different classes
Interactive scrollable map with tooltips for each language. |___> beginnings of this here: https://vizhub.com/Dastair/89b86bdaabc045408c10333b3ea01688?edit=files&file=index.js