Line chart of Coronavirus cases to date, by country. Data from Johns Hopkins Coronavirus Dataset.
Hover to see details and illuminate lines.
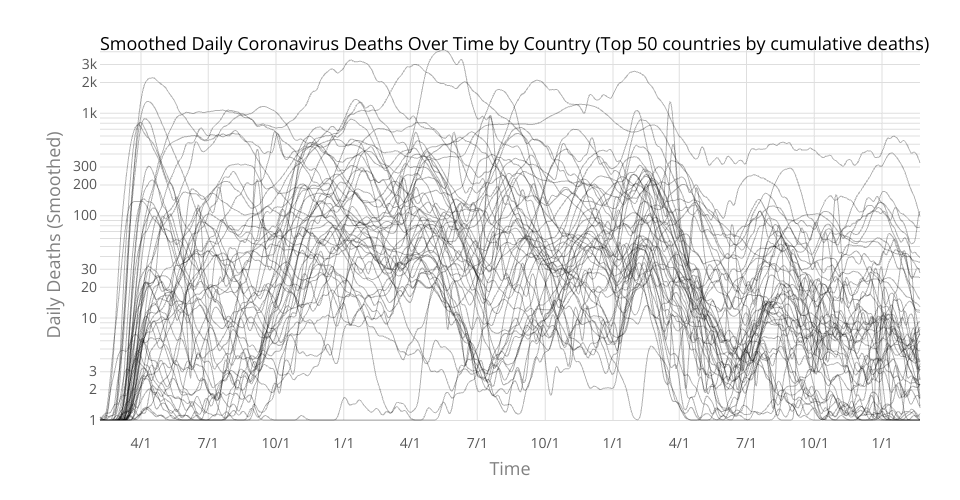
This variant shows daily death numbers, smoothed using the repeated averaging technique described in D3: Histogram Blur / Smoothing, for the top 20 countries by cumulative deaths.
MIT Licensed